TELEMETRY_SYNC_OK
T-AERO
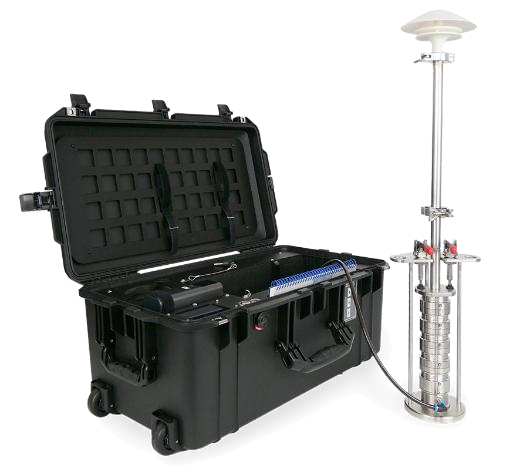
Bruker T-AERO 4-Stage Impactor and Transport Case
T-AERO Aerosol Sampling Package
4-stage stainless steel cascade impactor (Dae50: 10, 2.5, 1.0, 0.15 µm) sampling directly onto 30 mm TXRF reflector carriers for S4 T-STAR & S2 PICOFOX analysis.
T-AERO: Atmospheric & Aerosol Campaign Console
Active Site: Metavatiko Observatory, Ioannina · T-XRF / T-AERO 4-Stage Impactor · 39.6206°N, 20.8449°E · 480 m a.s.l.
PORTAL
Window
Live Weather · ECMWF IFS / ICON-EU Grid 0.1° · ~9 km
Sampling station map & location selector ? Sampling Location & Map Controls Global
  • Search any place: Type a city, campus, or address in the search bar and click Find.
  • Enter exact coordinates: Type Latitude (°N) and Longitude (°E) directly.
  • Pick on map: Click Locked to unlock, then click anywhere on the map (or drag the target pin) to position your T-AERO sampler.
  • Lock Location: Click Lock & Fetch to save the site and fetch live or historical meteorology for those exact coordinates.
39.620601°N, 20.844869°E · 480 m a.s.l. Click "Locked" to unlock & move pin
Wind & Weather Conditions ? Wind & Weather Overview Station Conditions

What it shows: The essential weather conditions at your sampling station (current reading in Live Weather mode, or period average in Historical Archive mode):

  • Compass & Wind Direction: Shows where the wind is blowing from (0° = North, 90° = East, 180° = South, 270° = West) and the animated airflow across the station.
  • Wind Speed: Air speed at 10 m above ground in m/s (and km/h).
  • Temperature, RH & Pressure: Ambient air temperature (°C), relative humidity (%), and barometric pressure (hPa).
LIVE NOW
N E S W
Wind speed
-- m/s (-- km/h)
Wind direction
--° --
Temperature
-- °C
Dew point: -- °C
Relative Humidity
-- %
Ambient moisture
Pressure
-- hPa
Surface barometric
Showing: Latest hourly observation --
4-Stage Cascade Impactor ? T-AERO 4-Stage Cascade Impactor Inertial Fractionation

How it works: Ambient air is drawn through 4 successively narrower nozzles onto 30 mm quartz/acrylic TXRF reflector discs. At each stage, larger particles with higher inertia impact onto the collection plate, while smaller unimpacted particles follow the airflow streamlines to the next stage:

  • Stage 1: Collects coarse particles > 10 µm (PM10)
  • Stage 2: Collects fine particles 10 – 2.5 µm (PM2.5)
  • Stage 3: Collects accumulation mode 2.5 – 1.0 µm (PM1.0)
  • Stage 4: Collects ultrafine particles 1.0 – 0.15 µm (PM0.15)
Dae50 Stages
Stage 1
> 10 µm
Coarse · PM10
Stage 2
10 – 2.5 µm
Fine · PM2.5
Stage 3
2.5 – 1.0 µm
Accumulation · PM1.0
Stage 4
1.0 – 0.15 µm
Ultrafine · PM0.15
Mean wind speedU10
--
Maximum--
Calm <0.5 m/sCALM
--
Hours--
Prevailing directionVEC
--
Vector mean azimuth--
Temperature 2 mT2M
--
Range--
Relative humidityRH
--
Hours >80%--
Pressure · rainPSFC
--
Rain total--

Wind rose

? How to Read the Wind Rose 16 Compass Sectors

What it is: A directional compass diagram showing where the wind blew from and how fast during the selected window.

  • Spoke direction (N, E, S, W): Points to the direction the air mass came from. Helps identify which upwind sources (city, highway, sea, industry) carried trace elements to your T-AERO sampler.
  • Spoke length (%): The concentric rings show the percentage of total hours the wind blew from that sector.
  • Colors (Speed bins): Each bar is stacked by wind speed—from calm stagnation (<0.5 m/s, amber) to strong transport winds (cyan/blue/purple).
16 sectors
<0.5 m/s (Calm) 0.5–1.5 m/s 1.5–3.0 m/s 3.0–5.0 m/s >5.0 m/s

Diurnal boundary-layer profile

? How to Read the Diurnal Profile 24-Hour Cycle

What it is: The average 24-hour daily cycle (00:00 to 23:00) combining Wind Speed, Air Temperature, and Relative Humidity across the selected days.

  • Cyan solid curve (left axis): Average wind speed U10 (m/s) at each hour of the day.
  • Orange dashed curve (right axis): Average temperature T2m (°C).
  • Blue solid curve (far-right axis): Average relative humidity RH (%).
  • Why it matters for T-AERO sampling: At night (20:00–08:00), cool air, high humidity, and weak winds trap aerosols near the ground (inversion). In the afternoon (12:00–17:00), solar warming and stronger winds mix the air vertically, diluting surface PM concentrations.
00:00 – 23:00 mean

Hourly time series

? How to Read the Hourly Time Series 3 Synchronized Panels

What it is: Hour-by-hour meteorological history aligned on a shared time axis so you can inspect conditions during any specific T-AERO sampling run.

  • 1. Wind Speed & Red Dashed Line (0.5 m/s): Whenever the cyan line drops below the red dashed 0.5 m/s line, the air is stagnant and local emissions accumulate rapidly.
  • 2. Temperature & Humidity: High RH (>80%) promotes hygroscopic water uptake on fine particles (PM2.5 / PM1.0).
  • 3. Pressure & Rain Bars: Blue vertical bars show rain events (mm/h) that wash particles out of the air (wet scavenging).
0
1. WIND SPEED U10 (m/s) & CALM STAGNATION THRESHOLD (0.5 m/s) RED DASH = 0.5 m/s STAGNATION LIMIT
2. AMBIENT TEMPERATURE T_2m (°C) & RELATIVE HUMIDITY RH (%) GAS-PARTICLE PARTITIONING & WATER UPTAKE
3. SURFACE PRESSURE P_sfc (hPa) & WET SCAVENGING PRECIPITATION (mm/h) WET SCAVENGING WASHOUT TRACKER

Hourly telemetry

PMF / OpenAir export
What the columns mean
U_10mWind speed at 10 m (m/s). This is speed, not direction.
AZIMUTHDirection the wind blows from, in degrees; 0° = north, 90° = east, clockwise.
SECTORThe 16-point compass sector matching the azimuth (e.g. 315° = NW).
T_2mAir temperature at 2 m above ground (°C).
DEW POINTSaturation temperature; the closer to T_2m, the higher the humidity and fog risk.
RHRelative humidity: percentage saturation of the air at temperature T_2m.
P_sfcSurface atmospheric pressure (hPa). Used to normalise sampled volume to STP.
RAINHourly precipitation depth (mm). Indicates wet deposition of particles.
Time U_10m (m/s) AZIMUTH (°) SECTOR T_2m (°C) DEW POINT (°C) RH (%) P_sfc (hPa) RAIN (mm)

Station documentation

Data sources and references for the T-AERO campaign.

1API and data sources

The application requests meteorological data from Open-Meteo over HTTPS REST for the active sampling station coordinates.

Live forecast (Live Weather). This is the weather expected in the coming hours and days. It combines two weather models, ECMWF IFS and DWD ICON-EU, and the application refreshes it every 60 minutes. Use it to plan the day — for example, to schedule a T-XRF reflector session before a calm, stable night traps PM close to the ground.

ERA5-Land (Historical Archive). This is a reconstruction of past weather produced by ECMWF for the Copernicus Climate Change Service (C3S) on a grid of about 9 km. A weather model is combined with real observations from radiosondes, surface stations and satellites, so the result is consistent over many years.

2References

Muñoz-Sabater, J. et al. (2021). ERA5-Land: a state-of-the-art global reanalysis dataset for land applications. Earth System Science Data, 13, 4349–4383. doi:10.5194/essd-13-4349-2021

Open-Meteo, https://open-meteo.com — public REST API.

Sampling logbook

A sampling date can hold several sessions. Each session records four T-XRF reflector samples (PM10, PM2.5, PM1.0, PM0.15) with start and stop times, sampled Liters (L) automatically converted to Volume (m³) (or entered directly in m³), carrier substrate (e.g. Borosilicate, Quartz Reflector), and complete Sample IDs. Data stays in this browser; export a JSON or Excel backup regularly.

Sampling DaysDAYS
0
Complete 4-stage days--
Samples (T-XRF Reflectors)SAMPLES
0
Four T-XRF reflectors per session--
Sampling Campaign Calendar Green = Sampling Day (click to filter records)
November 2026
MonTueWedThuFriSatSun
New sampling session
Stage Sample IDs (Complete Sample Names) 4 Stages · Editable
Sampled Air (Liters ↔ Volume)
596.91 L → 0.597 m³
Session & Substrate
120 min · Outdoor · Borosilicate
Sample IDs to be Saved
--
Each save adds a four-sample (T-XRF reflector) session to the date and updates the Records & Excel logbook. Saving the same start time again replaces that session.
Data safety

Data lives in this browser. Click "Save as Excel (.xlsx)" to export your laboratory spreadsheet or "Save JSON Backup (.json)" after every sampling session.

Last saved --
Records 0
Stop Date/Time Sample ID Stage Cut-off diam: D50 (µm) Area Substrate Run (min) Liters (L) Vol (m³) Notes Actions
Local store: taero_sampling_log_v1 · Excel export matches the laboratory T-AERO LogBook format (Liters L & Vol m³).
? Supported Import Formats .xlsx · .csv · .json

1. Excel (.xlsx) or CSV (.csv) Table: Import a spreadsheet with header columns matching the T-AERO LogBook:

Start Date/Time | Stop Date/Time | Sample ID | Stage | Cut-off diam: D50 (µm) | Area | Substrate | Run (min) | Liters (L) | Vol (m³) | Notes

Note: Either Liters (L) or Vol (m³) is sufficient — the other is calculated automatically (Vol = L / 1000).

2. JSON Backup (.json): Import a backup file previously saved via Save JSON Backup (.json).